Alternative data has gained a lot of traction in the investment space for providing a fresh outlook on economic performance of equities. These datasets are rich sources of alpha and can be used to predict key performance indicators for companies. This is where the power of Exabel’s platform can be tapped to extract maximum value out of the data. The entire cycle right from data exploration, transformation, backtesting, portfolio attribution and live tracking can be handled on a single platform. We are taking credit card transactions data from 1010data as an example, along with web traffic data as an adjunct to showcase that potential. You can take a deeper dive into the alpha testing of the constructed signal here.
Download the full whitepaper →
First things first: data preparation
Your strategy will never be better than the data you feed into it. The first step is therefore to explore the data by visualising and applying transformations that help you extract the valuable signals.
Visualising and transforming the data
We can start by dabbling with the signal explorer where we can visualise the data, and apply appropriate transformations to condition the data series. E.g. for credit card data, we can see seasonality effects clearly around the start of the year, and spikes around major holidays. The explorer gives the functionality of using different mathematical constructs to neutralise these effects. The charts here show the difference between the raw signal and the transformed signal which employs a year-on-year change of a 4 week moving average. You can also explore correlations with different signals for the same stock, and the same signal for different stocks.

Defining the company universe
The company screener is a very nifty tool offered by the platform to construct estimation and stock picking universes. You could use existing exchange tags to start building a universe, and then filter based on commonly known constructs like market capitalization, liquidity, trading volume or use your own signals to screen the universe. Our strategy includes stocks from New York Stock Exchange and NASDAQ with a minimum market capitalisation of $200M and a trading volume of at least 10000 shares on 80% of the last 90 trading days. These screens are all point-in-time constructs, so there is no forward-looking bias in the constructed universes.

Quantify alpha potential per signal
The alpha testing tool helps to do a quick backtest on your hypothesis. You can choose amongst a variety of settings to experiment with including allocation type, rebalance frequency, benchmark and trading costs, as shown in the figure below. You can also choose to compare multiple signal constructs in a single visualisation. There are several ancillaries provided in the results section which help you to derive more sensibility into the signal, which include factor attributions, coverage, turnover, portfolio risk, return by rank that would help you to work more efficiently with the portfolio strategy optimiser.


Constructing the portfolio strategy
The optimiser is one of the powerful tools in the platform which now helps you to combine single/multiple signals in a setting that extracts the most alpha. The optimiser is broken into 4 customisable sections namely:
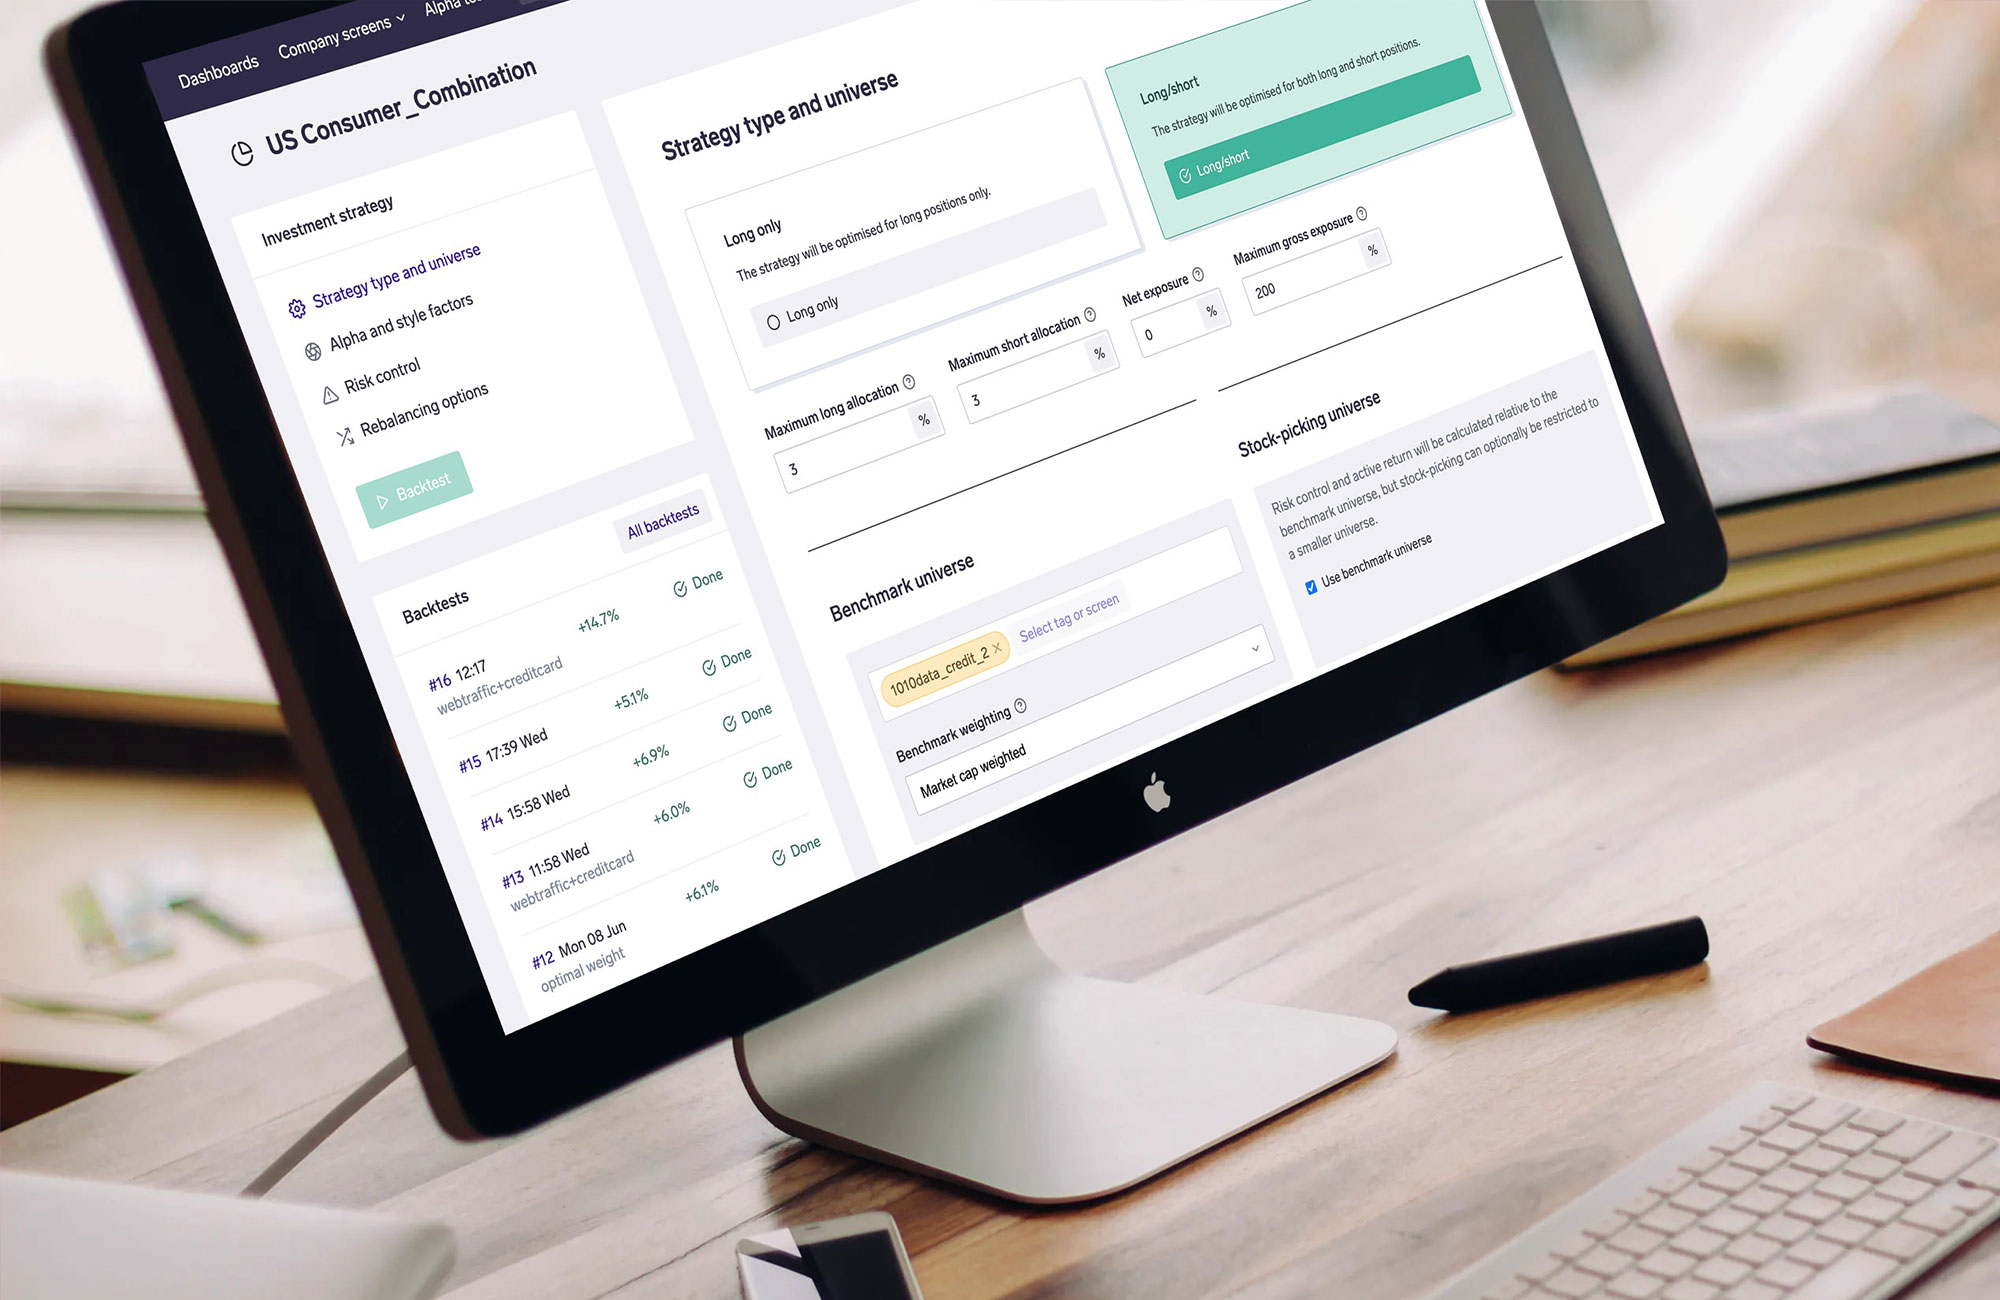
Strategy type and universe
Choose the type of strategy (long-short or long only) depending on the results from the alpha tester. From the results above , we see clear value in doing a long-short portfolio since the top quintile gives us positive returns while the bottom one gives negative returns. You can set the maximum allocations on a single stock, and your leverage depending on your portfolio mandate. E.g. Hedge funds typically do a 130/30 or a 150/50 portfolio with 130/150% long exposure, and 30/50% short exposure with not more than 3% allocation on a single stock. In this case they are trying to beat the performance of the benchmark by taking active long and short positions. You could also try and have a different stock picking universe than the benchmark universe. E.g if you only want to invest in stocks that have done well in the last 1 year, then you can use the company screener tool to limit, let’s say on the top 20% momentum stocks and use that as the stock picking universe.

Alpha factors
Include constructs in the combination and choose the normalisation style for your signal. You could run an alpha test in the grey tab to do a quick check on the performance of the constructs you are including in your strategy. The “Apply optimal weights” calculates the best set of weights during the training period to be used for the portfolio. In the example shown, we have used the credit card signal and the web traffic momentum as two indicators of alpha in the resultant portfolio.

Risk control and rebalancing options
Choose from various risk controls ranging from minimising exposure to benchmark to minimising tracking error/absolute volatility. The strategy runs a Markowitz mean-variance optimisation in the background with the given constraints to find the best allocations. You could choose specific factor tilts on this screen as well. The weight option can be customised to give lesser/greater weight to volatility to achieve greater/lesser active returns at the cost of the Sharpe Ratio. If you observe stocks moving in and out of your portfolio frequently, you can switch on the “Minimise Turnover” option to add penalties in the objective function for high turnover.
Choose the rebalancing frequency and backtesting period, with optionality of putting in transaction costs for each trade. Auto-filter extreme movements would remove any stocks from consideration that have greater price jumps than the given threshold.
Interpreting your backtest results
The final set of results reflects the most important backtest metrics on the top, and then breaks down the performance into commonly known style, industry and country components. Turnover, coverage, leverage, industry and sector exposures are shown across time to gauge the portfolio better in terms of the benchmark. Most importantly, you can track the portfolio allocations individually on each stock to see changes across different rebalances.
Return and risk metrics
The simulations are made using equal bet size, meaning that one unit of funds is invested each day allocations are made, without reinvesting the returns from the previous allocation. So comparison with a linear trend would give an idea of the profitability of our portfolio allocation. Sharpe ratios are ideal to evaluate long short portfolios that are cash neutral. Information Ratios on the other hand capture the spread relative to the benchmark, and hence are suitable for portfolios with a long tilt.

Style components
The returns are broken down into commonly constructed style factors like momentum, value, size etc. to identify the specific return that remains after accounting for the above. The market factor is essentially the benchmark weighted return of the coverage universe. It’s helpful to see that the portfolio has a tilt towards momentum and growth stocks, as suggested by our signal constructs, which bet in favour of consistent performers. You could also see how the individual factors have done in the past, and the historical portfolio exposures by clicking the little icon besides the actual numbers, to give better idea of choosing factor tilts.

Sector and country exposures
A useful visualisation to identify any systematic tilts taken towards industries and countries. In the example shown, we can see a heavy exposure to consumer stocks, which is understandable given the weightage to webtraffic and credit card transactions. The sector is heavily influenced by the use of credit cards, and their online presence.

Allocations
Perhaps the most useful tool as the result of a backtest, this button could be used to generate the latest allocations for you to check what stocks are ranking at the top, and which ones are moving out of the most recent portfolio. The green highlights indicate the stocks with the biggest changes since the previous allocation. You could export these values as excel files for further analysis and/or paper trading.

Enable continuous tracking of your strategy
The final step of the workflow is to enable tracking, which lets you monitor the allocations and performance of your strategy going forward. This lets you confirm that the strategy performs as indicated in your backtests.