Introduction
Exabel’s Vendor Value Summaries provide investors with an overview of new alternative datasets integrated into the platform, covering the sector strengths as well as ticker examples where the data asset adds insight. You can access a PDF version of the pass_by Vendor Value Summary below.
Where Does This Fit Into the Mosaic?
pass_by offers high-resolution visibility into physical consumer behavior, critical for sectors where foot traffic directly correlates with revenue. The platform uses a large, well-calibrated panel. It excels particularly in the U.S. market, supporting businesses such as off-price retail, hospitality, and restaurants—industries where a significant amount of transactions occur offline.
What differentiates pass_by?
Unlike competitors that rely solely on aggregated GPS data, pass_by trains and validates its models using hardware sensors with 99% accuracy, providing reliable ground truth validation. Most geolocation foot traffic providers have significant sample sizes of cell phones, but the calibration to real-world traffic is critical.
Performance
The vendor delivers a consistently strong signal. The United States emerges as a particularly robust region, with high-quality predictive signals. Top-performing sectors:
- retail
- restaurants
- hospitality
Tactical Application Examples
Hilton Worldwide Holdings, Inc. (HLT) – Sector Hospitality Services
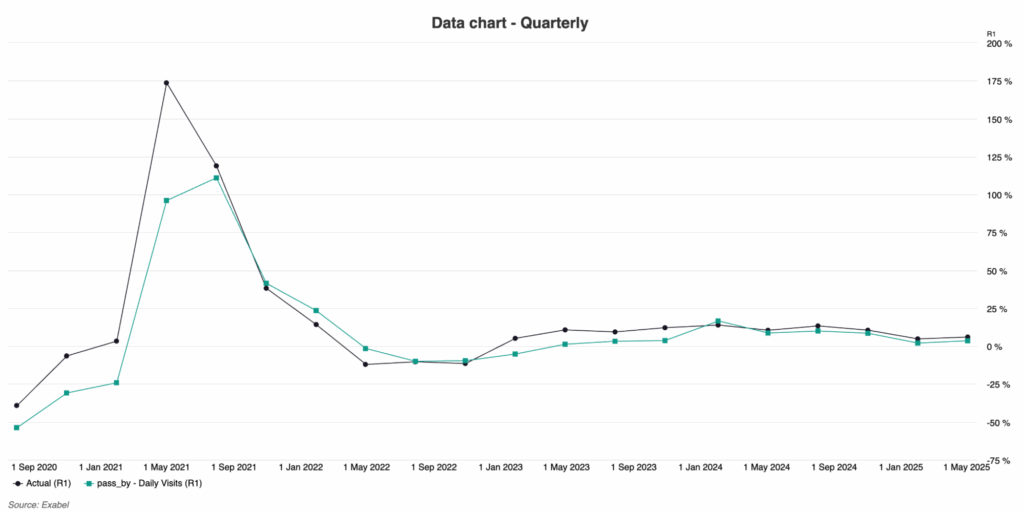
The hospitality sector exemplifies how pass_by data can add significant value. Analyzing Hilton’s system-wide RevPAR (Revenue per Available Room) metric, daily visits from pass_by provide one of the strongest predictive signals.
RevPAR, which assesses the efficiency and profitability of Hilton’s room inventory, is calculated as either:
- Total Room Revenue ÷ Total Available Rooms, or
- Occupancy Rate × Average Daily Rate (ADR)
In this context, pass_by data serves as a proxy for occupancy rate—simply put, higher daily visits generally indicate a higher occupancy rate.
Modeling RevPAR using only foot traffic or only transaction data yields reasonably accurate results. However, combining these two data sources significantly enhances model accuracy. Over the past eight quarters, this integrated approach has reduced the Mean Absolute Percentage Error (MAPE) to 1.9%, compared to 2.8% with foot traffic alone and 4.4% with transaction data alone.
This underscores the value of geolocation data and the benefits of a mosaic approach to modeling. Specifically, transaction data is most effective for estimating the average daily rate, while geolocation data excels at capturing occupancy rates.
Burlington Stores, Inc. (BURL) – Food and Staples Retail
The off-price retail model is an ideal use case for geolocation data. pass_by data consistently outperforms all other datasets in terms of historical accuracy for estimating total revenues at Burlington (BURL).
Burlington’s strategy centers on delivering a “treasure hunt” in-store experience, offering branded apparel and home merchandise at discounted prices. This physical, discovery-based shopping model naturally aligns with geolocation analytics: store traffic is a direct reflection of consumer engagement and potential revenue.
Summary
pass_by delivers a high signal-to-noise ratio and is particularly effective where physical traffic correlates directly with business outcomes. Its unique sensor-based approach offers validated, real-time data that stands apart in a GPS-dominated market. This makes pass_by an essential component of a mosaic data strategy—especially in sectors where geolocation insights are crucial.
For more information on pass_by’s geolocation dataset, click the button below.
About pass_by
pass_by leverages groundbreaking AI to analyze the customer journey in the $4tn brick-and-mortar commerce market. pass_by enables retailers and those with a vested interest in the brick-and-mortar world to measure, analyze and predict the future of the customer journey.
pass_by’s foot_traffic for finance provides ground truth-validated footfall data for 1,422 publicly traded and 5,657 privately held retail brands. Built on location data from 177 million daily devices and validated against hundreds of thousands of in-store sensors, sales data, and a dozen other data inputs, it delivers the most accurate view of store traffic in the market. With up to 0.98 year-on-year correlation to reported sales, the dataset enables financial institutions to model retail performance, analyze brand health, and understand shifts in retail environments with unmatched precision.
About Exabel
Exabel is an end-to-end platform designed to help investment teams seamlessly integrate alternative data with traditional financial metrics. The platform offers advanced analytical tools that enhance KPI forecasting, uncover key drivers, and streamline workflows, empowering teams to make more informed investment decisions.
Disclaimer
This document is provided by Exabel AS. It is for information purposes only. It is not an invitation or inducement to engage in any investment activity and it does not contain investment advice. The information in this document shall not be relied on in making any investment decision or in connection with any contract or otherwise. Exabel AS makes no representation regarding, and accepts no liability or duty of care for, the accuracy, completeness or timeliness of the information in this document or its fitness for any particular purpose or use.
© Exabel AS, 2025