As the leading source of information on the pricing trends of clothing retailers and manufacturers around the globe, Ascential is the best place to help analysts better understand trends in the industry and insights behind specific companies in the apparel sector.
The Gap, Inc. is one of America’s largest fashion corporations with a portfolio of well-known brands such as Old Navy, Gap, Banana Republic, and Athleta. The business operates as an omnichannel retailer selling its products in various ways, such as: through company owned stores, franchised locations, and online websites to name a few. Despite possessing strong brands, the company is rebuilding; in the last earnings call, the management indicated that they are looking to realign its growth trajectory through a series of critical changes. Management’s emphasis on expanding margins through promotional recovery is a focal point in these changes. In Q1, the company outperformed its GPM expectations primarily through leveraging improved promotional activity. However, the challenges remain as inflationary headwinds remain in Q2. Management has guided that it expects a net improvement of 200 bps in 2Q GPM as a result of all of its initiatives. In light of these strategic changes underway at GPS, we analyze all its significant brands’ pricing and discounting trends and supplement our analysis with inventory discussions as needed.
Old Navy, the ‘old faithful’ brand for The Gap, Inc. was the primary driver behind the company surpassing street’s margin expectations in Q1. The discounting trends in Q2 indicate that the outperformance has continued – we see a significantly lower breadth of discounting among its product offering , with the average markdowns being only slightly higher year-over-year.
Breadth and Depth of Discounting – Old Navy (US)

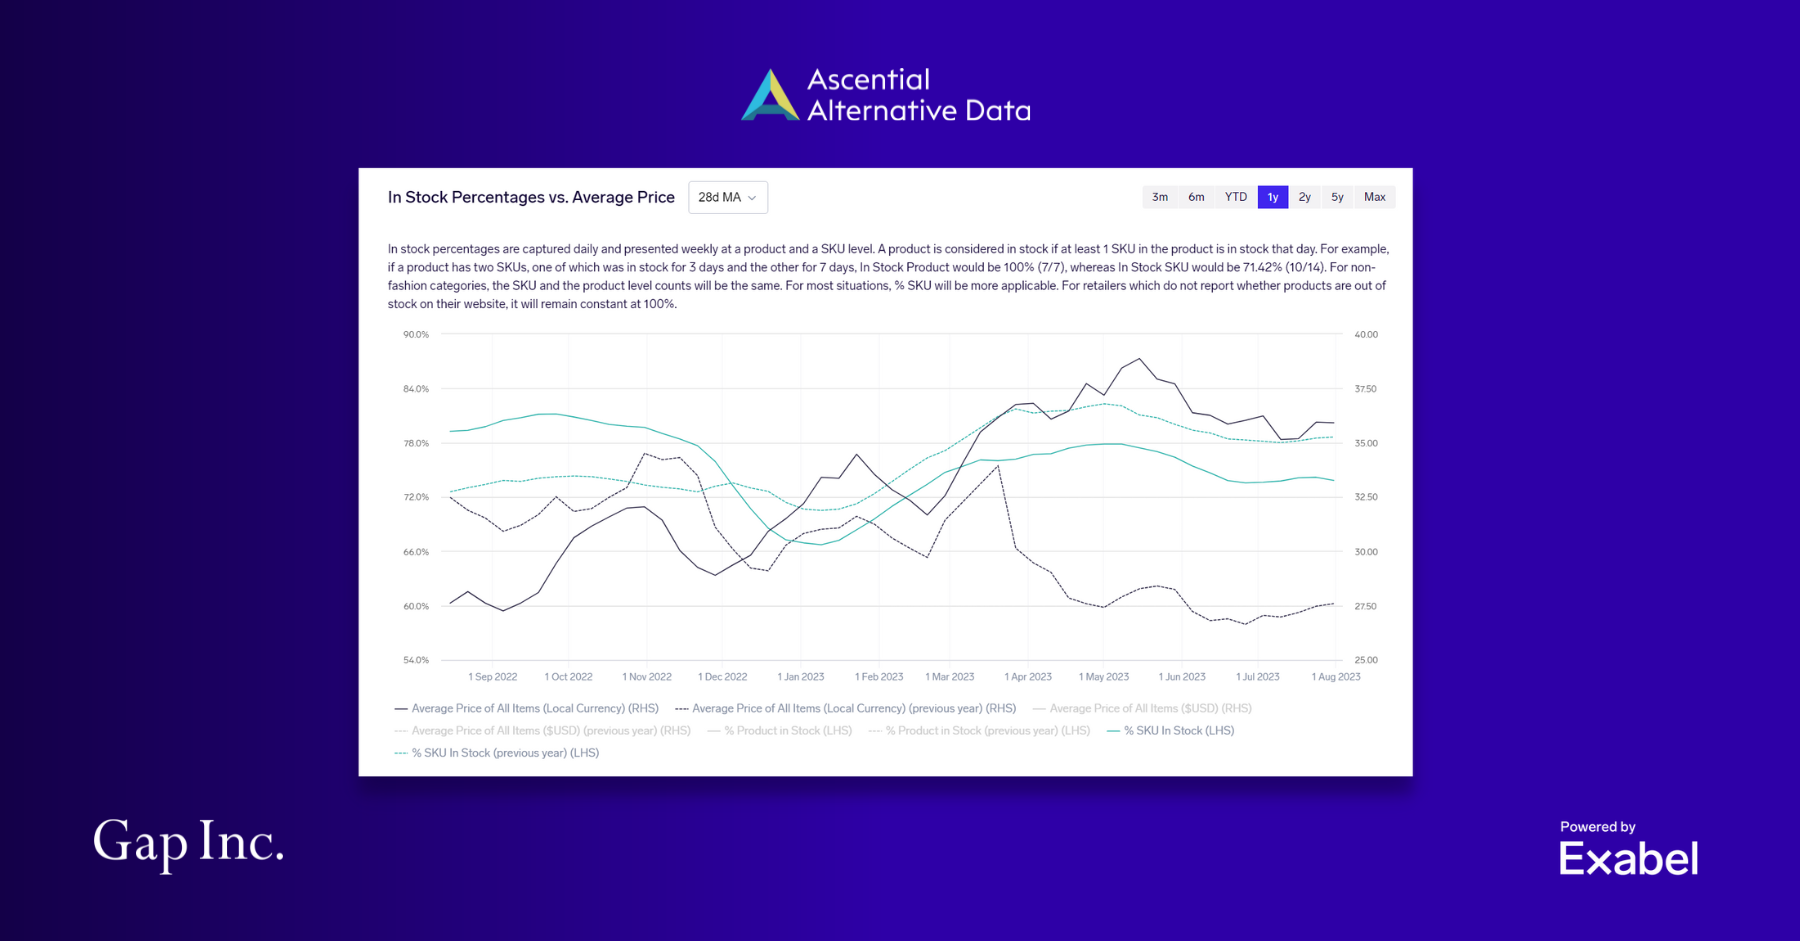
These low discounting trends at Old Navy have been accompanied by higher average ticket prices for their products. However, despite the higher prices and lower discounts we observe that the in-stock percentages for the brand have dipped year over year.
The primary demographic that Old Navy appeals to has lower income than the other brands, hence it is expected to face more challenges with inflationary headwinds. Yet, the combination of pricing , discounting and availability patterns that we have observed in the data give a strongly indicate that Old Navy is well on its way to overcoming these headwinds and contributing to margin expansion in Q2.
In Stock Percentages vs. Average Price – Old Navy (US)

Gap is The Gap, Inc’s second largest brand (by revenue). In contrast to GPS’s other brands, its comparable sales grew (+1%) in Q1; however similar to the other brands, it too is being restructured to operate with better profit margins. In Q2, we saw the breadth of discounting of Gap branded products decrease notably while the average markdown percentage (depth of discounting) decreased moderately for its operations in the US.
Breadth and Depth of Discounting – Gap (US)

In addition to the lower discounting trends seen at GAP, our data also picked up a significantly higher average price for GAP products on a year over year basis and lower inventory levels for Gap SKUs. Together, all of these trends point to the brand’s success in managing its inventory levels better and to the fact that the customers have not reacted adversely to their price increases for now. Considering the stated management objectives, the analysis above points to the brand’s success in focusing promotions on the kind of inventory that the customer wants rather than having to resort to markdowns for unused/leftover merchandise.
In Stock Percentages vs. Average Price – Gap (US)

Banana Republic is the premium/luxury brand in The Gap, Inc.’s portfolio. The brand’s comparable sales in Q1 were notably lower than the year before as it lapped an exceptionally tough comparison of +27% growth in the last year. The improvement in discounting trends at Banana Republic has been more muted than at Old Navy and Gap. Although we did not see any changes in the breadth of discounting, the depth of the discounting decreased materially compared to the previous year.
Breadth and Depth of Discounting – Banana Republic (US)

Banana Republic increased average prices on a year over year basis thanks to the lower depth of discounting, but its inventory levels were roughly the same as last year throughout Q2. Thus, it failed to achieve the inventory reduction observed across Old Navy and Gap brands; hence we do not expect it to contribute meaningfully to the expansion of gross profit margins in Q2.
In terms of year over year comparable sales change, Athleta was the worst-performing major brand in the GPS portfolio. In the last earnings call, management emphasized returning the brand to its performance roots by changing the product assortment. In Q2, we have seen some evidence of management executing that as the number of products at Athleta is much below the year ago period (this trend has continued from Q1). That being said, we do not see any significant shifts in the discounting patterns, pricing or availability patterns for the brand in Q2, which is in line with expectations since the brand is still working through a lot of old inventory that they need to get rid of before introducing new products.
Number of Products – Athelta (US)

Our analysis indicates that Old Navy and Gap brands decreased their reliance on promotional strategies and have successfully maintained low inventory levels despite higher prices in Q2. Although there may be much room left before achieving its long-term goals, the data indicates that GPS will enhance its profit margins successfully in Q2.
About the dataset
The Ascential dataset is a curated offering of pricing and promotion insights for equity analysts and portfolio managers. Through meticulously scraping information on over 35 billion records collected over the past nine years, Ascential provides a unique view into corporate pricing strategies, discounting levels, and even wholesaler/retailer dynamics.
Hosted on the Exabel platform, a proven alternative data investment research platform used by many of the world’s leading investment teams to make better, data driven investment decisions. As Ascential is retained by retailers to obtain this data, there is significantly lower compliance risk – notably, the company has never received a cease and desist from a retailer. Ascential has become the industry-leading source of pricing and promotion insights for retailers and financial professionals alike.


