Deriving unique, investable insights from multiple sources of alternative data is challenging, but with the right technology you can harness the true power of alternative data.
Originally published November 15, 2023
Introduction
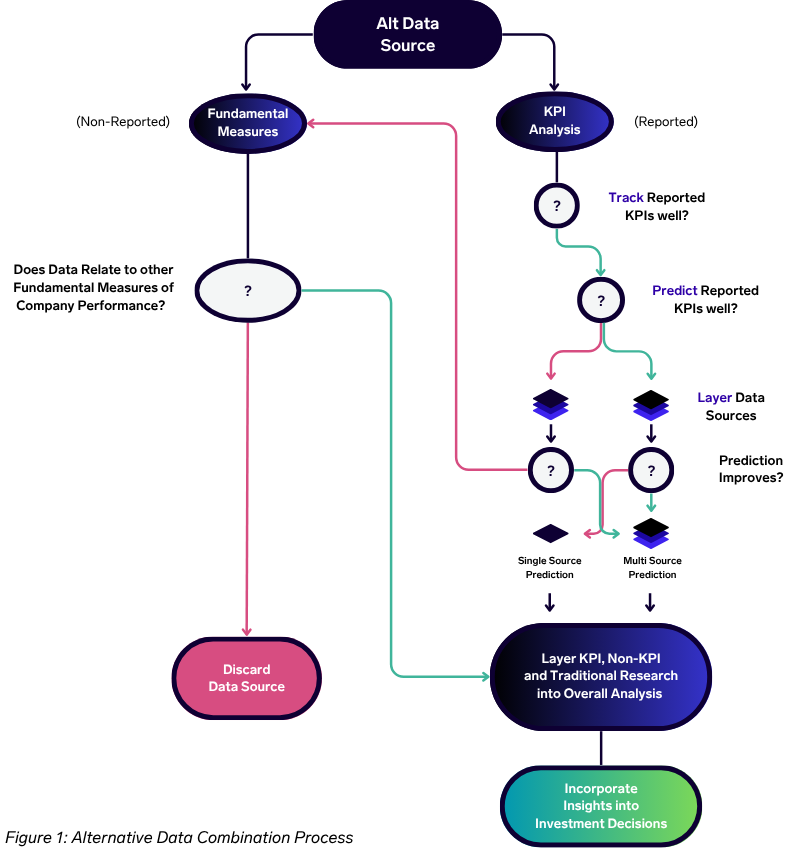
Finding creative and powerful combinations of alternative datasets is proving to be one of the most-effective methods for professional investors to find opportunities for outperformance. As alternative data analysis has matured into a critical component of the investment process, from idea generation to risk management, deriving custom analysis has become an increasingly important method for sustaining alpha. This white paper will outline the best-in-class process, and the resulting challenges, for evaluating alt data asset combinations for two primary use cases: 1) Reported KPI Predictions and 2) Non-Reported Fundamental Measures of Company Performance.
Background
In the early 2000s, the investment landscape saw a revolutionary shift with the advent of alternative data. Pioneering hedge funds began to tap into non-traditional data sources such as credit card transactions, geo-spatial data, and web scraping to gain a unique, asymmetric advantage in the market. These novel data streams allowed for a deeper, more nuanced understanding of market trends and investment opportunities beyond what traditional financial metrics could unveil.
As the adoption of alternative data gained momentum, challenges like “alpha decay” emerged. The initial advantage of unique insights began to wane as more market participants started utilizing similar data sources. This erosion necessitated a continuous innovation in sourcing and analyzing alternative data, urging investment professionals to perpetually seek fresh perspectives and approaches to maintain a competitive edge and achieve sustainable alpha.
Recent advancements in technology have facilitated the democratization of alternative data. Tools and technologies required to capture, process, and analyze vast and varied datasets have become more accessible and cost-effective. These advancements have enabled even smaller firms to leverage the power of big data, allowing for a broader participation and competition in the pursuit of market-beating insights.
Today, alternative data is experiencing a renaissance. In a January 2023 survey commissioned by Exabel, 100 discretionary portfolio managers and investment analysts overwhelmingly viewed alternative data as mainstream for institutional investors. Moreover, the majority anticipated a significant growth in their organization’s use of alternative data, both in terms of datasets and overall expenditure. As alternative data enters a more mature phase of its lifecycle, there’s a resurgence in its proliferation and utility. The accessibility of robust tools and the advent of cloud technologies have unlocked unprecedented opportunities, enabling investment firms to craft informational advantages through deep expertise in data analysis.
Looking ahead, the landscape is ripe with opportunities for those with a nuanced mastery of alternative data analysis. With the barriers to entry lower than ever, a diverse array of participants can innovate and thrive, fostering a vibrant, competitive ecosystem where expertise and innovation in data analysis remain pivotal in driving investment success.
KPI Analysis
KPI (Key Performance Indicator) analysis stands as a cornerstone in the utilization of alternative data within investment strategies. At its core, the objective is clear – transform raw data into actionable investment insights.
To fulfill this objective, there are two important criteria that alternative data must meet. Initially, a robust relationship between the data and company performance must be established, ensuring that the data serves as a reliable mirror reflecting organizational health and strategy. Additionally, the market must respond to the KPI in significant regard, influencing the company’s valuation.
In an ideal setting, investment analysts and portfolio managers would allocate a more considerable portion of their alt data efforts towards mastering this latter element, navigating the intricacies of market reactions and valuation adjustments. However, a prerequisite to this nuanced analysis lies in the meticulous preparation of data, ensuring its readiness to yield valuable, actionable insights.
Data Preparation
Data preparation is a pivotal process that often dictates the usability and ultimate value of alternative data in investment workflows. Even for firms equipped with substantial resources to manage extensive internal data operations, the logistical demands of preparing data can significantly overshadow the benefits. Rich Brown, ex-Head of Data Management at Citadel, notes that in the data sourcing “process… each day that passes… is a day that alpha is not realized.” In Exabel’s January survey, 53% of investors reported struggling to process alternative data in a usable format for their fundamental investment workflow. For smaller firms, navigating user interfaces primarily designed for corporate functions like marketing and HR further amplifies this challenge, necessitating substantial restructuring efforts to integrate data into investment workflows.
Take the case of Flywheel Alternative Data (previously Ascential), a provider that collates pricing, promotion, and availability metrics across a plethora of retailers at the individual SKU level. While some metrics, such as availability, are optimally analyzed at the SKU level to capture granular insights into product variant performance, others like pricing and promotion are more illuminating when aggregated at the product level. For instance, when determining metrics like Average Selling Price, the data necessitates precise resampling to ensure accurate period comparisons, avoiding undue weighting biases.
Moreover, a multidimensional analysis may be required, dissecting the data by variables like retailer, country, channel, and brand manufacturer. Such granularity enables a nuanced understanding of market dynamics, empowering analysts to, for example, compare the performance of Nike products at Foot Locker against competitors like Adidas, thereby uncovering potential market movements following Foot Locker’s quarterly results.
Exabel’s platform is uniquely positioned to alleviate these challenges. Tailored to meet the specialized needs of investment professionals, the platform simplifies and optimizes the data preparation process, making it less resource-intensive and more aligned with investment workflows. It offers over 75 pre-integrated alternative data sources, streamlining the onboarding of new data and facilitating a more seamless analytical experience. These tools allow even smaller firms to efficiently navigate and utilize extensive data sources, focusing more on deriving actionable insights rather than wrestling with logistical complexities.
Exabel’s platform is a conduit through which investment professionals unlock substantial value from their alternative data. In the realm of data preparation, Exabel facilitates an environment where the intrinsic value of data is not obscured by operational complexities or logistical bottlenecks. Clients benefit from tailored solutions that resonate with the unique demands of investment workflows, ensuring that the data is not merely usable, but optimized for insightful analysis.
This facilitation is more than a time-saving convenience; it is a strategic enabler, allowing firms, especially those with limited resources, to delve deeper into their datasets, unveiling opportunities that might otherwise be lost in the intricacies of data preparation. By doing so, Exabel ensures that the actual analytical process, the derivation of actionable insights, remains the focal point of the investment professionals’ efforts, maximizing the return on their data investments.
Directional Indicators vs. Predictions
The next step in KPI analysis is the exploration and mapping of KPIs. Investment professionals must judiciously determine the extent of KPI mapping, a critical decision that significantly influences the derived value from the data. Without a committed investment in comprehending and customizing these relationships, firms may find themselves reliant on the vendor’s static and restrictive ‘ticker mapping’, risking accelerated alpha decay.
Exabel’s platform offers a strong foundation for this crucial phase of analysis. The pre-integrated datasets come with default mappings, providing analysts with a strategic starting point. These mappings are not just static points of reference; they are dynamic tools. Exabel allows for exceptional customization, enabling analysts to make necessary adjustments swiftly and efficiently, tailoring the datasets to meet specific analytical objectives and ensuring that the data is not only accessible but also immediately actionable.
| Type | Required History | Difficulty of Analysis | Alpha Decay Exposure |
| Directional Indicator | 2+ Years | Low | High |
| Single-Source Prediction | 3-5+ Years | Moderate | Moderate |
| Multi-Source Prediction | 3-5+ Years | High | Low |
Figure 2: KPI Analysis Methods
Mapping Directional Indicators:
Investors embark on a detailed process where various data points are synchronized with relevant KPIs, carefully calculating correlations to ascertain genuine relationships. This process, leveraging absolute, quarter-over-quarter (QoQ), and year-over-year (YoY) trends, becomes a powerful asset in filtering metrics that offer reliable directional indicators. Such indicators are instrumental in minimizing the noise from spurious relationships, providing a refined focus on credible analysis.
Chart 1: Directional Indicator
Investment professionals typically require a comprehensive dataset, optimally spanning over three years, to identify robust directional indicators. These well-scoured indicators, in turn, become potent candidates for predictive models, amplifying their value in the analysis process.
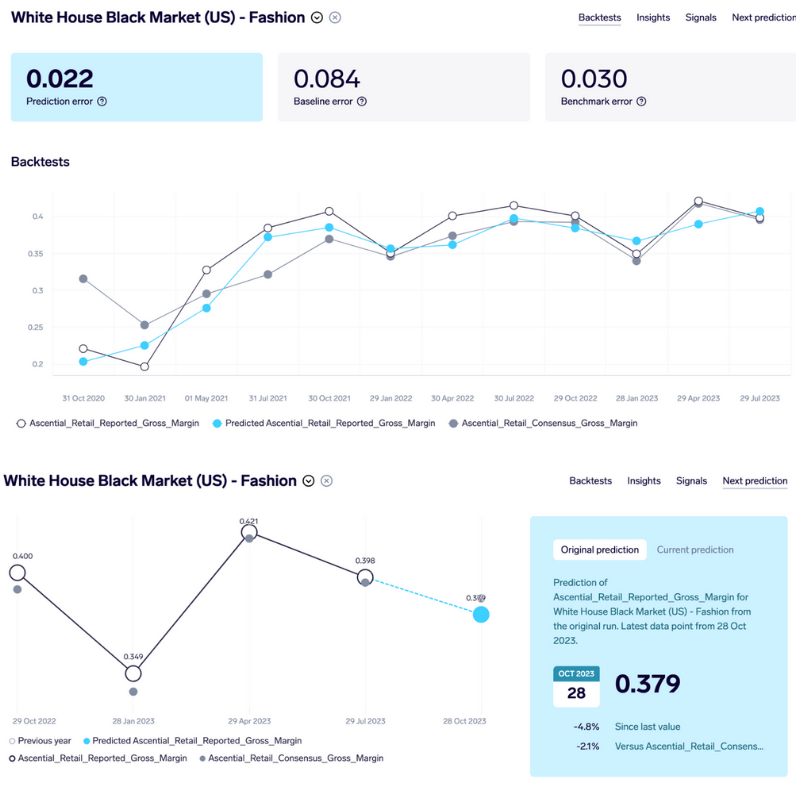
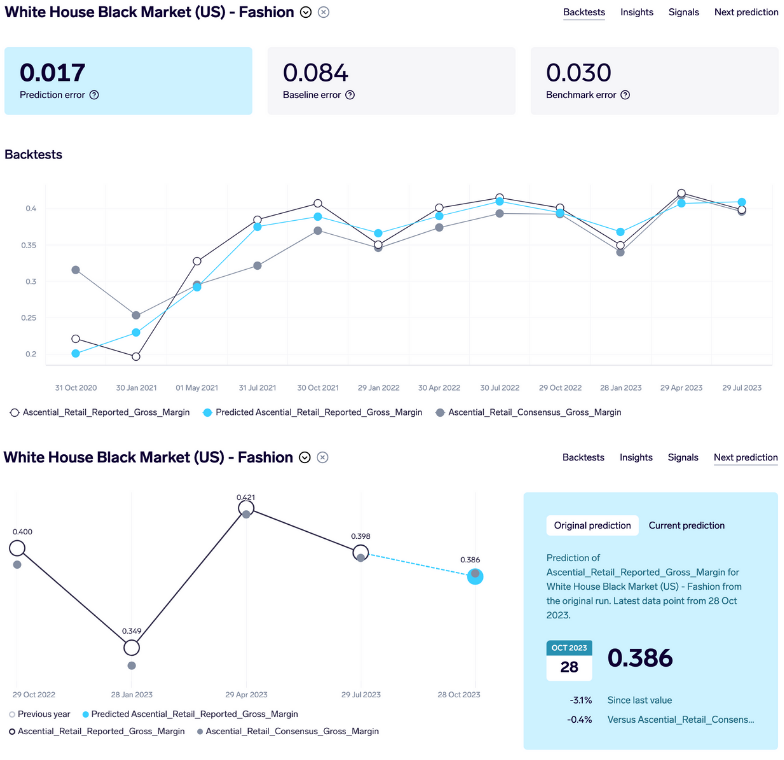
Predictive Modeling
The transformation of directional indicators into predictive models necessitates an exhaustive analysis, often leveraging at least five years of data to nurture precision and reliability in predictions. These predictive models, thoroughly evaluated through metrics like Mean Average Percentage Error (MAPE), correlation analyses, and hit-rate calculations, form actionable insights. An added layer of sophistication involves comparing these predictions against consensus models and correlating them against market surprise, honing the model’s relevance.
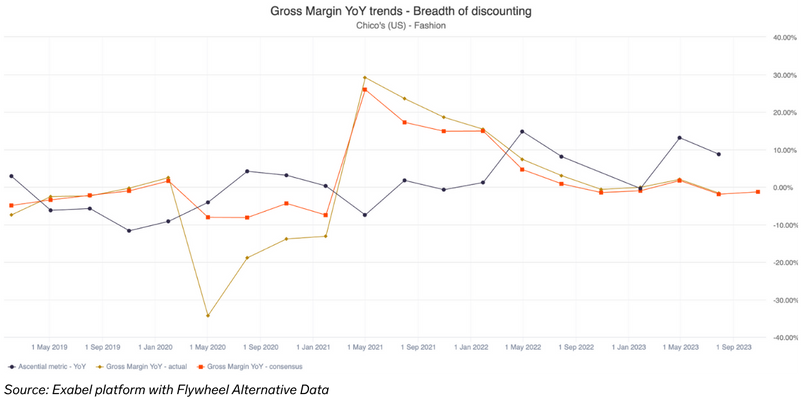
Consider the application of this process in evaluating the directional impact on the gross margin of a fast-fashion retailer using data from Flywheel (Chart 2). For instance, the ‘breadth of discounting’ metric is analyzed for its relationship to Gross Margin, exploring the co-movements on a YoY basis. A linear regression model could then be employed to predict the impact of this metric on gross margins.
Chart 2: Single-Source Prediction
Going further, the analysis could intertwine the breadth and depth of discounting, fashioning a composite discount factor. This synthesized metric, when subjected to predictive modeling, improves accuracy, forging a powerful tool that provides a more intricate understanding of gross margin dynamics.
Exabel offers advanced predictive modeling tools that encapsulate a spectrum of sophistication. From the comprehensible linear regression models to the intricate realms of machine learning models, Exabel ensures that investment professionals have access to a diverse array of tools that align with their strategic objectives.
Multi-Source Predictions
The journey of maximizing the value derived from alternative datasets doesn’t end at the utilization of a single data source. However, most investors still struggle to achieve this objective, as according to Exabel’s survey, 71% of investment professionals found combining data from different sources to be the most challenging problem faced when analyzing alternative data. An evolved strategy to augment the robustness of predictive models and enhance information advantages involves the synergistic combination of multiple, non-correlated datasets. Traditional data providers typically operate within silos, each offering a fragment of the broader analytical canvas.
Unlocking superior insights requires a bespoke approach, harmonizing various unique datasets, each contributing an exclusive analytical dimension. This bespoke amalgamation of disparate datasets enhances the depth, diversity, and predictive accuracy of the analytical models, ensuring that they resonate more harmoniously with market intricacies and dynamics.
Consider, for instance, the integration of macroeconomic indicators and card transactions data with promotional data from providers such as Flywheel (Chart 3). Such a confluence allows for the infusion of a cost of goods sold (COGS) perspective into the gross margin predictions. By weaving together these diverse strands of data, the predictive model for one KPI becomes more nuanced, capturing a broader spectrum of influencing factors and improving prediction accuracy by 23% (see Figure 3 for contribution by signal). This multi-source approach amplifies the model’s ability to discern intricate market patterns and trends, paving the way for a more refined and reliable predictive output.
Chart 3: Multi-Source Prediction
This process can be repeated with different alternative data sources in many ways. For example, foot traffic data, POS transaction data, mobile app data, and store manager or customer survey data combine to predict the brick-and-mortar same-store sales KPI. Furthermore, for the online sales KPI, e-commerce scraped data combined with credit/debit data and clickstream data could be layered into a single prediction. These examples demonstrate how data mosaics can be built and tuned into a full ensemble of KPI predictions.
Exabel’s platform is architectured to facilitate continuity and compatibility across multiple stages of data evolution and expansion. Once a firm has traversed the journey of refining and utilizing a dataset, KPI, or company analysis within Exabel, each subsequent addition or enhancement seamlessly integrates into the existing analytical ecosystem.
This compatibility is foundational to Exabel’s platform and supports the ongoing journey of data enrichment, allowing firms to continuously build upon and expand their datasets, KPIs, and company analyses. The intrinsic design of Exabel ensures that the new layers of data or analyses not only coalesce seamlessly but also enrich the existing structures, facilitating a harmonized and powerful multi-source prediction model.
By ensuring seamless interoperability and integration of new data layers, Exabel’s platform makes the ambitious goal of multi-source predictions more attainable and less cumbersome, allowing investment professionals to focus on extracting value and insights rather than wrestling with compatibility and integration challenges.
Fundamental Measures
Fundamental measures within alternative data often unveil unique insights, even beyond KPI analysis. These measures are not just ancillary data points; they form a significant epicenter of value, offering a fertile ground where multiple investment theses can be cultivated and tested.
Every data source carries latent potential, a realm of fundamental measures that can be harnessed in myriad ways, leading to a richness of insights. Investors, with their nuanced hypotheses, engage in an ongoing dialogue with data, questioning, probing, and extracting value, building narratives around whether and how ‘x’ impacts ‘y’, and in the process, crafting strategies that transcend the ordinary and illuminate pathways to outperformance.
Chart 4: Fundamental Measures

Consider, for instance, the task of dissecting the audience landscapes of two omnichannel competitors (Chart 4). An analyst keen on understanding the relative market shares of these entities might delve into a diverse array of data: geospatial data paints a picture of foot traffic, clickstream data unveils online shopping behaviors, and app engagement data reveals mobile shopping trends. By integrating these diverse datasets, a more comprehensive and nuanced understanding of consumer behaviors and preferences can be achieved, contributing to a rich, multi-faceted investment thesis.
The Exabel platform’s tools become instrumental in streamlining and visualizing the complex narratives forged through the exploration of fundamental measures, facilitating a more integrated and coherent analytical process that aligns seamlessly with an investor’s strategic vision and analytical objectives.
Conclusion
Navigating the complexities and uncovering the profound insights nestled within alternative data is an evolving odyssey, one marked by continual discovery and refinement. This white paper has journeyed through the multifaceted landscape of applying alternative data in investment strategies, illustrating the tremendous, yet nuanced value it bestows—from optimizing data preparation processes to advancing multi-source predictions.
Investors are presented with a vibrant tableau of opportunities, enabling the formulation and testing of diverse investment hypotheses. The fundamental measures, often underappreciated, emerge as core pillars, bolstering the robustness of investment analyses and strategies. These signals don’t merely augment existing frameworks but ignite new paradigms of understanding, enhancing the predictive prowess and strategic depth of investment portfolios.
Exabel’s role emerges as a catalyzer in this exploratory journey, aligning technological innovation with the investor’s curiosity and creativity. Through a flexible and intuitive platform, Exabel fosters an environment where data’s potential can be fully harnessed, reducing operational burdens and empowering investors to delve deeper, exploring the vast realms of possibility that alternative data unfurls.
In this dynamic interplay between data and strategy, investors are armed with the tools and insights to transcend traditional boundaries, enabling deeper engagement with the market’s complexities and crafting investment strategies that are both resilient and visionary.
This document is provided by Exabel AS. It is for information purposes only. It is not an invitation or inducement to engage in any investment activity and it does not contain investment advice. The information in this document shall not be relied on in making any investment decision or in connection with any contract or otherwise. Exabel AS makes no representation regarding, and accepts no liability or duty of care for, the accuracy, completeness or timeliness of the information in this document or its fitness for any particular purpose or use.
© Exabel AS, 2025