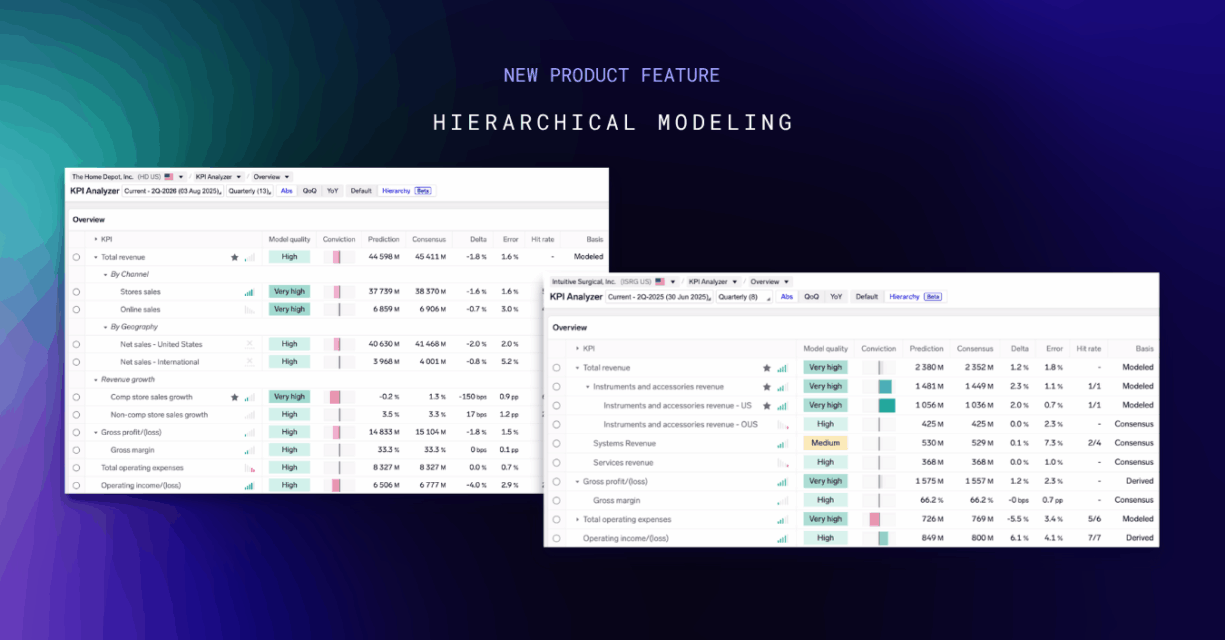
Exabel has introduced hierarchical modeling — a major upgrade to our KPI forecasting suite — designed to give buy-side investors more accurate, consistent, and insightful predictions using alternative data, including the ability to model profitability metrics like gross and operating profit.
Traditional approaches treat each KPI in isolation, training separate models that use different data sources for each KPI. This leads to two key challenges:
- Inconsistent predictions: Since each KPI is modeled in isolation, predictions may contradict each other. For example, if a company reports Total revenue split into US and International segments, separate models might use different transaction or traffic data sets. As a result, predicted US and International revenue may not sum to the Total — eroding trust in the model.
- Limited visibility into profitability: Most alternative data models stop at top-line KPIs like revenue, leaving analysts to manually assess the bottom-line impact. At the same time, newer datasets — such as pricing and promotional data or workforce insights — offer visibility into gross margin and opex, but remain underutilized in current modeling approaches.
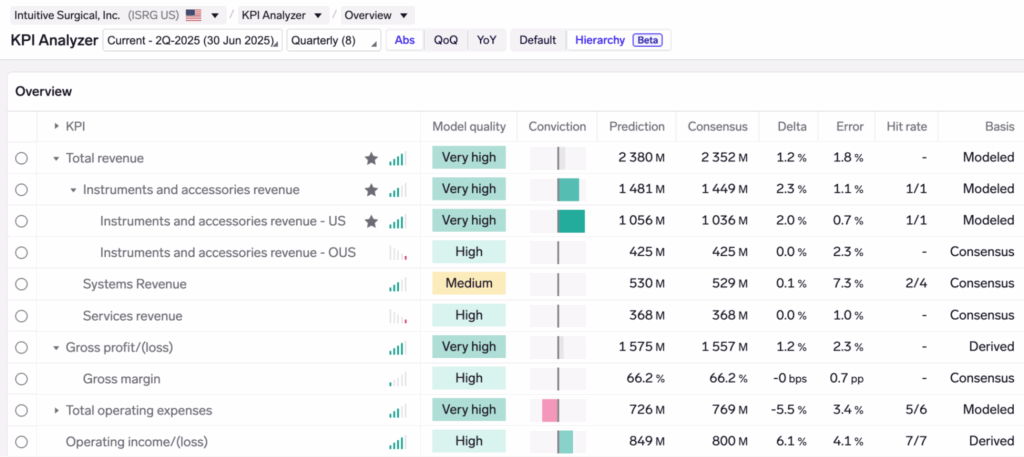
Exabel addresses both challenges by combining the structure of a financial model with machine learning. Just as an analyst builds a spreadsheet with formulas — for example, Total Revenue = (US + International) or Gross Profit = (Total Revenue x Gross Margin) — hierarchical models link KPIs using these same fundamental relationships, which are then incorporated into the modeling process to produce more accurate and consistent predictions.
This approach also allows the use of the most relevant alternative data sources for each KPI — such as US, Europe, or Asia-specific datasets for regional segments, or geolocation and web data for in-store versus online channels — ensuring that the models leverage the best signals available while producing predictions harmonized across a company’s financials.
This delivers three key benefits:
- Improved model accuracy, driven by better use of relevant alternative data
- Predictions are harmonized across KPIs.
- Ability to forecast profitability, including gross and operating profit, by modeling the impact of operating leverage
Early results show a 2–4 percentage point reduction in MAPE (mean absolute percentage error) across many tickers compared to traditional approaches.
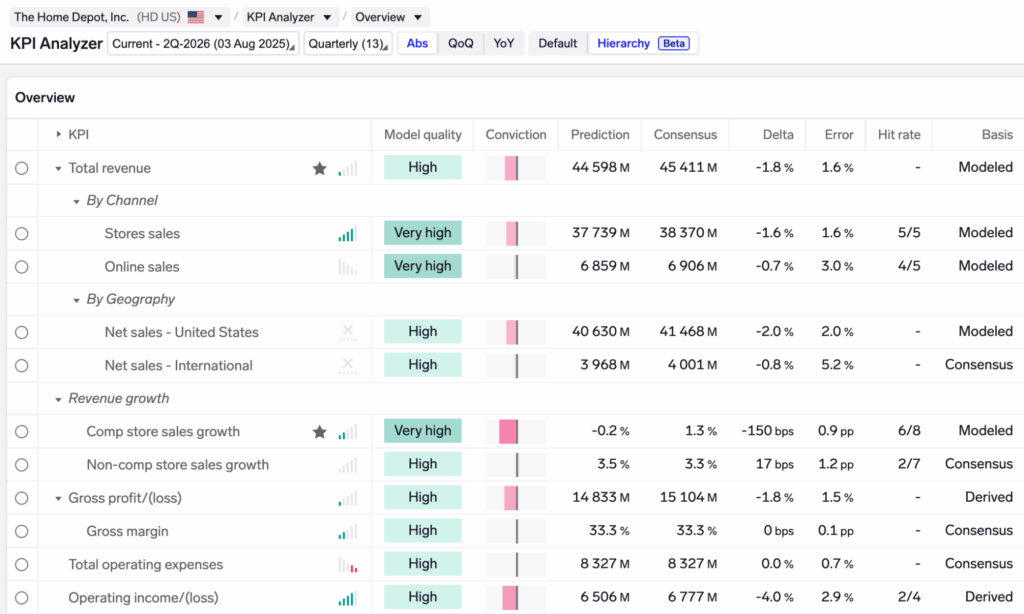
“Hierarchical modeling combines the structure of a financial model with the power of machine learning,” said Zac Yang, VP Product at Exabel. “The models mirror how investors already think — KPIs are laid out like an income statement, with segment breakdowns and margin calculations that flow naturally. That makes predictions both more trustworthy and intuitive to work with.”
Tim Harrington, CEO of BattleFin & Exabel, added further, “This exciting new feature enhances the way investors can work with alternative data, getting deeper insight into a company’s profitability and understanding the impact of operating leverage through hierarchical modelling in a scalable, repeatable way.”
The new models are currently in beta and available for customer preview. Exabel will begin rolling hierarchical modelling out across its coverage universe in 3Q 2025, prioritizing tickers based on customer demand.
To find out more information or see the Exabel platform in action, request a demo via the button below.