Recently, we announced the launch of Import Jobs, which provides a direct Snowflake integration for you to easily bring your data into Exabel. This furthers our goal of helping customers analyze all their alternative data in one place, leveraging Exabel’s analytics to combine data sets and derive differentiated insights.
In this blog post, we will cover how a customer can import an entire data set from Snowflake into Exabel within minutes, schedule regular imports of new data, and begin visualizing, analyzing, and evaluating data.
Background
A major bottleneck in the evaluation and use of alternative data is the time and cost associated with ingesting data. Currently, this requires days or weeks of specialized data engineering resources, in order to set up data pipelines that extract, transform and load (ETL) data from an alternative data provider into the customer’s own environment. Analysis can only begin after this stage, lengthening the data evaluation process and time-to-alpha.
Exabel’s Import Jobs feature simplifies this process by allowing non-technical users to create data pipelines using only SQL queries, and is performant enough to allow importing entire data sets within minutes.
Import Jobs is currently available in beta. We’re excited to open this up externally and work with early customers to refine & test this feature in the weeks ahead – please contact your account manager to join the beta program, or reach out for a trial of the Exabel platform.
Sample Data Set
Here, we demonstrate Import Jobs using the Similarweb S&P 500 sample data set available on the Snowflake marketplace. This data set provides metrics such as visits, visit duration, bounce rates, and pages per visit. The data is segmented by website domain and desktop/mobile, and covers the time period from January 2018 to January 2022.
For the demo, we focus only on aggregated ticker-level visits. Note that Exabel also supports importing data at lower levels of granularity, which will be the subject of a future blog post. This is also a sample data set – Similarweb provides significantly more depth in their full data set.
Setting up an Import Job
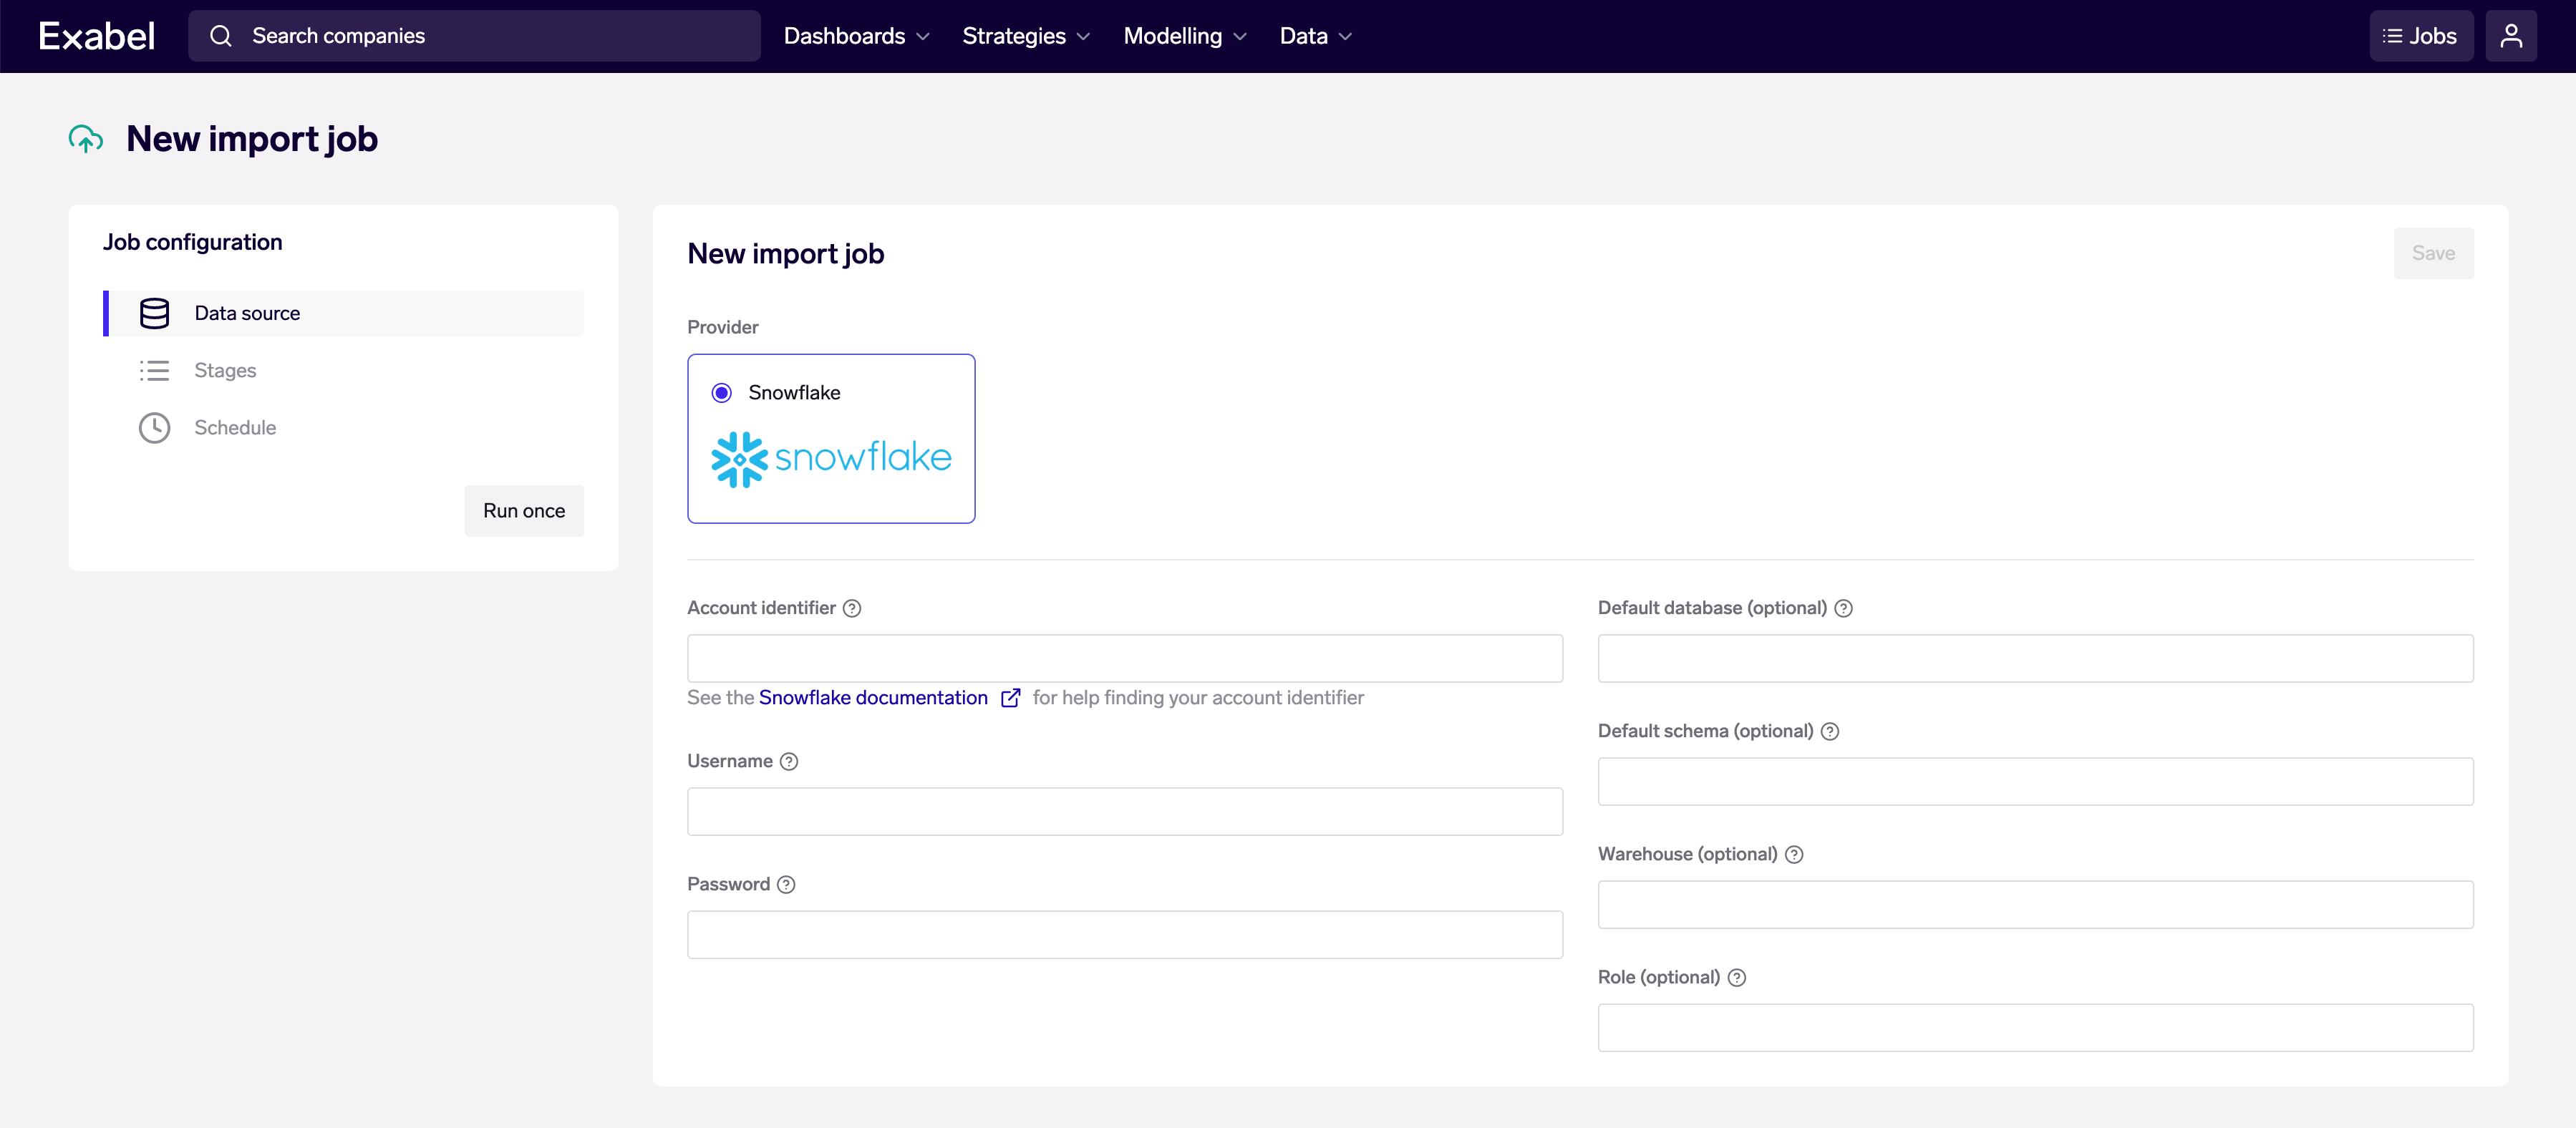
Import Jobs are accessible from the Exabel app menu, under Data → Import Jobs. Create a new Import Job, then set up your data source as a Snowflake connection, with your account credentials and database connection details.

We use a Snowflake account in the AWS US-East-2 (Ohio) region, with a “medium” warehouse that has 1 cluster.
Next, we create the “stages” within an Import Job. Stages allow users to import complex data sets with multiple levels of granularity – e.g. data at company-level and brand-level. In this case, we only need one stage as we have chosen to only import aggregated ticker-level time series. We create an “Import Time Series” stage and configure it as follows:

The SQL query is as follows:
We construct the query to return a Bloomberg ticker identifier for mapping, dates of each data point, and a separate column for each raw signal to be imported – in this case, total / desktop / mobile visits. The Similarweb data set has some dual ticker listings that map to the same company, so we de-duplicate these with a subquery.
Finally, Exabel has native point-in-time support for all time series data. We know that the Similarweb data is available within a 2-3 day lag, so for the historical data import, we apply a 3 day offset. This allows us to apply point-in-time evaluation to avoid look-forward bias, when using running backtests in Exabel analytics tools.
Running & Scheduling
After configuring an Import Job, we can do a test run by clicking on the “Run once” button. The sidebar on the left shows our recent runs. We can also view the full list of runs, and click in to view detailed logs for troubleshooting.
Here, we see that the Similarweb data set took just over 2 minutes to import completely.

When we’re satisfied with our Import Job, we can instantly turn it into a live data pipeline by going to the “Schedule” tab and specifying a cron schedule for recurring job runs.

Visualization & Transformation
After the Import Job has run for the first time, the data is available within the customer’s private namespace, and signals are automatically created in the Library, in the “Upload” folder. This can be opened in Exabel’s Signal Explorer for to visualize and transform data:
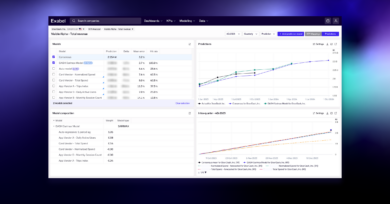
Next, we use Exabel’s Signal Explorer to visualize and transform our imported data. In a few clicks, we generate two derived signals based on the raw total visits data, and plot them on an interactive chart:
The syntax above utilizes Exabel’s domain-specific language (DSL), which extends the Python language with purpose-built functions for financial / investment analysis. See our documentation for a full description of available functionality.
When we are satisfied with our new derived signals, we can save them to our Library for subsequent use in charts, dashboards, models and strategies; this also enables us to share our work with our team.
Analysis – Correlation
Exabel’s Signal Explorer also allows us to interactively run correlation analyses while we develop signals, to check if our transformations are able to produce a better proxy metric for a company KPI we care about, and to identify companies that might be well-covered by a data set under evaluation.
The beauty about the derived signals we created earlier is also that once created, the same transformations can be applied to any and all companies for which data exists. Here, we take the same “mean over actual fiscal quarters” transformation, apply it across total / desktop / mobile visits, and analyze their correlations to revenue across the entire sample data set.

The correlation table above shows Pearson correlations of the main revenue signal vs three Similarweb visits signals aggregated over quarters, applying YoY differences to produce a more robust analysis. We see that while correlations are not universally high across the entire sample data set, many tickers demonstrate high correlation – these are unsurprisingly concentrated in the travel & leisure sector.
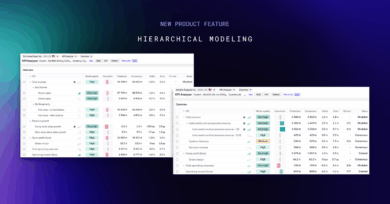
Dashboarding
Finally, in addition to the charts and correlation analysis built earlier, we can create dashboards that display our saved signals across a watchlist or universe of names.

Dashboard tables can be populated with a tag of entities, in this case the sample data’s coverage universe. This coverage tag was created automatically by the Import Job.
We can then bring in any number of signals as columns. In this example dashboard, we add the 3 raw data signals corresponding to total / desktop / mobile visits, with a 28-day moving average + YoY transformation applied. We also include signals that calculate quarter-to-date (QTD) trends, consensus estimates for the same quarter, the overall YoY correlation between visits and revenue, and some market data metrics. Columns can also be grouped for easier interpretation.

Once we have created a dashboard, we can browse its contents by sorting and filtering on columns, so as to identify where growth or correlations might be strongest. Dashboards may also be shared with our team, who may also choose to make copies to personalize based on their preferences.
Summary
In this blog post, we showed how our new Import Jobs feature can be transformational to you and your data teams, reducing data set ingestion from days / weeks to minutes, letting you move quickly to data evaluation and the development of insights and views.
Stay tuned for part 2, where we ingest a second data set with different dimensions and characteristics, and explore more of Exabel’s analytical capabilities.